Designing
reports that have multiple row groups is a relatively common requirement in Reporting
Services. This often means implementing either a block or multi-column stepped
formatted report to display those groups (i.e., this post does not apply to a
stepped format where all row groups appear in a single column using padding or
spaces to offset the groups). The problem with these formats occurs once the report has been exported to Excel. To maintain the look of the report, Excel merges the
cells of those row groups; however, to work with the data in Excel (e.g. sort,
copy & paste selections into other worksheets, etc.) you’ll need to
eventually unmerge those cells. Unfortunately,
Excel doesn’t automatically fill in those unmerged cells with data where it
exists. In part 1 of this 2-part post, I show how this can be accomplished for a block formatted report that has been exported to Excel.
A block format displays row groups in columns side by side as in the example below:
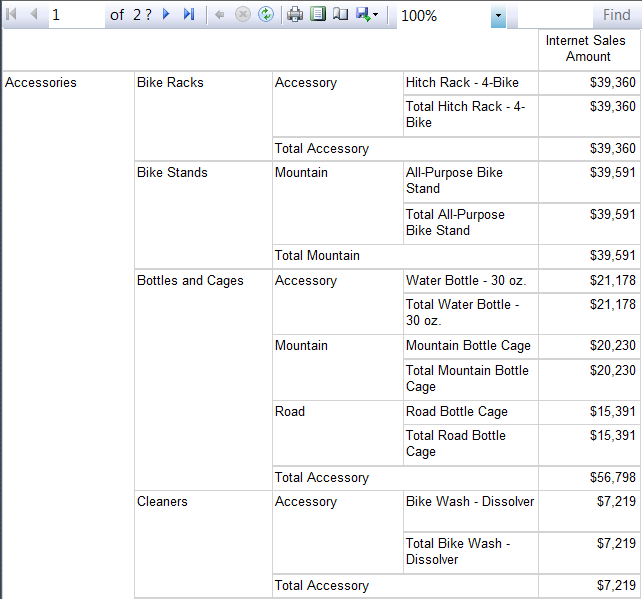 |
| Block Format |
When this report is exported to Excel, it will look very similar, using merged cells to accomplish the formatting. To fill in the cells, do the following after exporting the report to Excel:
- Click the Enable Editing button (if necessary)
- Select the cells for the entire worksheet
- From the Home tab, click Merge & Center -> Unmerge
NOTE: Here
is where you may want to re-evaluate your report design. If Excel has had to
create merged column cells in your table to accommodate lining up header
images, report titles, etc., you may want to try to prevent that. By doing things like conditionally formatting header images to
not export to Excel, stretching title textboxes to be the same width as the tablix, etc., the report will export in a more Excel friendly format.
- Select just the range of cells that represent the row groups (i.e., the row labels) of the tablix
- From the Home tab, click Find & Select -> Go to Special… -> Blanks
At this point just the blank cells that represent the row groups should be selected as in the image below:
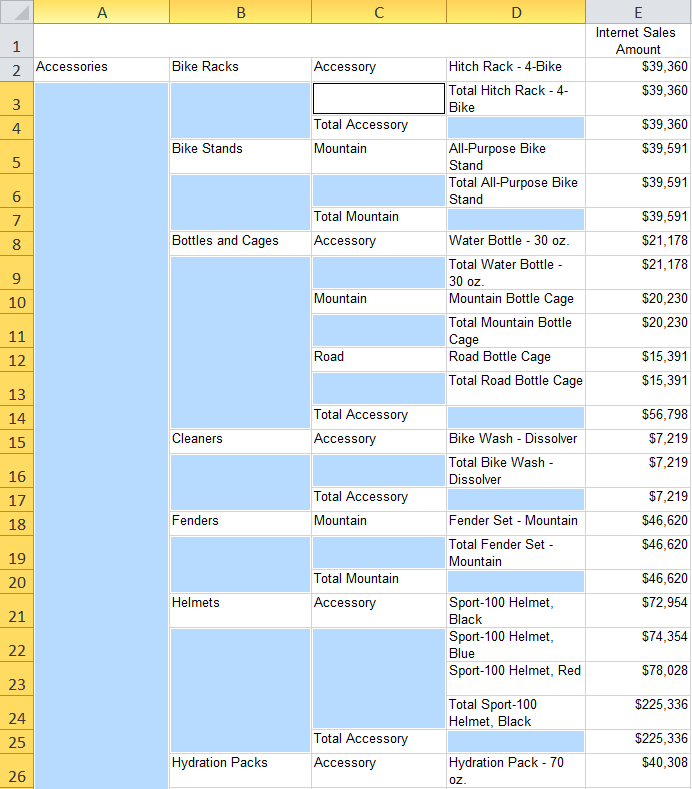 |
| Blank Cells Selected |
- Holding down the Ctrl key, select a highlighted blank cell
- Click in the formula box and type the equals sign (i.e., =)
- Click on the cell above the selected cell (e.g., if your selected cell is C3, click on C2)
- Holding down the Ctrl key, hit the Enter key (this will copy the formula to all selected cells)
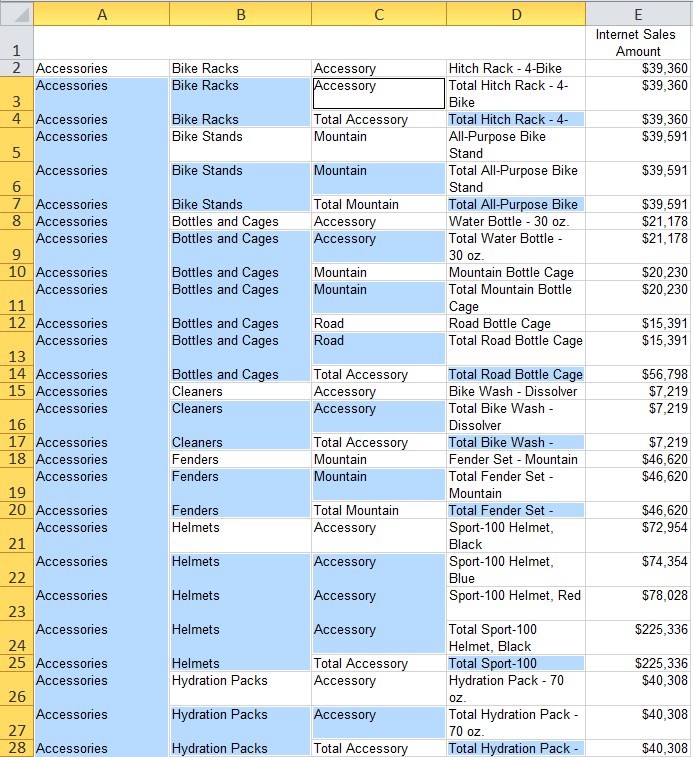 |
| With Cells Filled In |
- Again, select just the range of cells that represent the row groups (i.e., the row labels)
- From the Home tab, click Copy
- Click Paste -> Values to replace the formulas with the actual values
You should now have a usable spreadsheet that you can sort or copy and paste rows into other worksheets, etc.
No comments:
Post a Comment