In this post, I'm going to show you an easy trick using SharePoint's Query String (URL) Filter to create complex and dynamic dashboard filter connections for PerformancePoint Scorecards and Reports.
If you‘ve built any PerformancePoint dashboards, you’ve undoubtedly created and connected PerformancePoint Filters to scorecards and reports (Analytic Grids, Analytic Charts, Reporting Services Reports, etc.) to create powerful and interactive dashboards.
A simple (and maybe not so powerful) example, which I will build upon, would be creating a Customer Country filter using the AdventureWorks SSAS multi-dimensional database and connecting it to an Analytic Grid report summarizing data based on the Customer dimension's Customer Geography hierarchy, as in the figure below:
By this point you can see that there is great potential in using a Query String (URL) Filter with MDX functions. Using this trick you can create very dynamic dashboards which can be controlled using query string parameters instead of having to hard code a conditional formula into PerformancePoint Filter. Just remember, as with anytime you are passing query string parameters in a URL, make sure that you understand how a savvy user may try to modify it to gain access to information that you did not intend.
If you‘ve built any PerformancePoint dashboards, you’ve undoubtedly created and connected PerformancePoint Filters to scorecards and reports (Analytic Grids, Analytic Charts, Reporting Services Reports, etc.) to create powerful and interactive dashboards.
A simple (and maybe not so powerful) example, which I will build upon, would be creating a Customer Country filter using the AdventureWorks SSAS multi-dimensional database and connecting it to an Analytic Grid report summarizing data based on the Customer dimension's Customer Geography hierarchy, as in the figure below:
 |
| Figure 1: A Not So Powerful Example of Using a PerformancePoint Filter |
Slightly less common is utilizing a PerformancePoint Filter’s
Connection Formula to filter a report in a more sophisticated manner using MDX functions (see Extend PerformancePoint dashboards by using MDX queries for a thorough explanation of Connection Formulas).
For example, you could add the following simple MDX function as a Connection Formula to modify the filter connection created above:
<<UniqueName>>.Children
This formula would apply the Children MDX function to the value of the filter and when applied to the Customer Geography hierarchy, would summarize the measures by State-Province (i.e., the child level of Country).
 |
| Figure 2: A More Powerful Example Using a PerformancePoint Filter with a Connection Formula |
The Query String (URL) Filter
Another filter that can be useful for PerformancePoint Dashboards is SharePoint's Query String (URL) Filter. This filter allows you to access a query string parameter and pass its value to a connected PerformancePoint Scorecard or Report. I use Query String (URL) Filters for a couple of different scenarios: one is when I want to link dashboards based on an attribute hierarchy by having a hyperlink on a dashboard (e.g., in an embedded SSRS report) which navigates to, for example, a dashboard focusing on a particular parent or child geographic area. The other scenario is when I have a parameter with hundreds or thousands of options (e.g., counties) and instead of populating a PerformancePoint Filter, I use a custom search box control to set a query string argument which is used to filter the dashboard. There are certainly drawbacks to this filter, like having to reload a page or having an attribute member value exposed in a URL, but it is also very powerful and it can open up new possibilities in your dashboard design.
Using this filter is fairly straightforward allowing you to add the filter to your dashboard and specify the query string parameter name.
Using this filter is fairly straightforward allowing you to add the filter to your dashboard and specify the query string parameter name.
 |
| Figure 3: Query String (URL) Filter Web Part Editor |
By passing an attribute member value (e.g., [Geography].[Geography].[Country].&[United States])
in the “area” query string parameter, we can accomplish the same thing that the PerformancePoint
Filter did without the Connection Formula. The URL would look something like the following, where "area" is the name of the query string parameter (make sure to URL encode the parameter value, otherwise it may not work):
http://servername/site/subsite/Dashboards/AdventureWorks/Page1.aspx?area=%5BCustomer%5D.%5BCustomer+Geography%5D.%5BCountry%5D.%26%5BUnited+States%5D
Using this type of filter opens up the possibility of dynamically controlling what is being summarized in a report via the URL. The problem with this approach, however, occurs when you want to create a more sophisticated filter using something similar to the PerformancePoint Filter's
Connection Formula. There is no interface to enter a Connection Formula for a Query String (URL) Filter, so it can't be done. At least that's what I thought until recently when I started playing with the query string parameter value and discovered that I could apply MDX functions directly in the URL.
For example, we can use the same Children MDX function used above directly in the URL, passing [Geography].[Geography].[Country].&[United States].Children as the query string value.
The URL encoded query string would look like the following:
http://servername/site/subsite/Dashboards/AdventureWorks/Page1.aspx?area=%5BCustomer%5D.%5BCustomer+Geography%5D.%5BCountry%5D.%26%5BUnited+States%5D.Children
This allows us to produce the exact same results as when we used the PerformancePoint Filter with the Children MDX function in the Connection Formula, as shown below:
 |
| Figure 4: Producing the Same Results Using a PerformancePoint Filter (left) and a Query String (URL) Filter (right) |
With this knowledge, I began to try slightly more
complicated MDX formulas. For example, I could pass TopCount({Descendants([Customer].[Customer Geography].[Country].&[United States], 2)}, 10, [Measures].[Internet Order Count])
http://servername/site/subsite/Dashboards/AdventureWorks/Page1.aspx?area=TopCount%28%7BDescendants%28%5BCustomer%5D.%5BCustomer+Geography%5D.%5BCountry%5D.%26%5BUnited+States%5D%2C+2%29%7D%2C+10%2C+%5BMeasures%5D.%5BInternet+Order+Count%5D%29
This would produce something similar to the following:
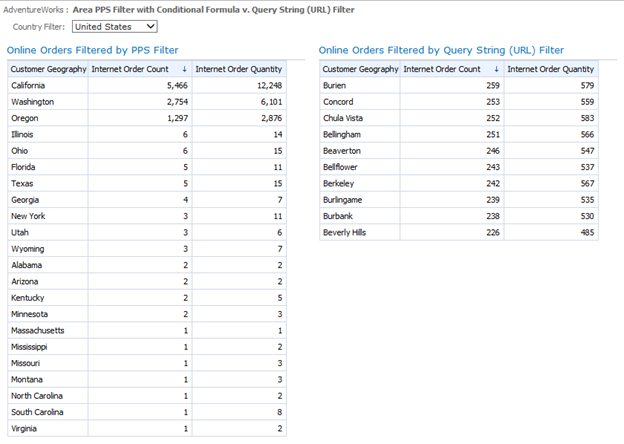 |
| Figure 5: Top 10 U.S. Cities Based on Internet Order Count (right side) |
By this point you can see that there is great potential in using a Query String (URL) Filter with MDX functions. Using this trick you can create very dynamic dashboards which can be controlled using query string parameters instead of having to hard code a conditional formula into PerformancePoint Filter. Just remember, as with anytime you are passing query string parameters in a URL, make sure that you understand how a savvy user may try to modify it to gain access to information that you did not intend.


