In my last post, SSRS: Filling in Cells of Reports Exported to Excel (Part 1), I showed how to fill in the cells of a block formatted report that has been exported to Excel. In this post we'll do the same thing for a stepped formatted report.
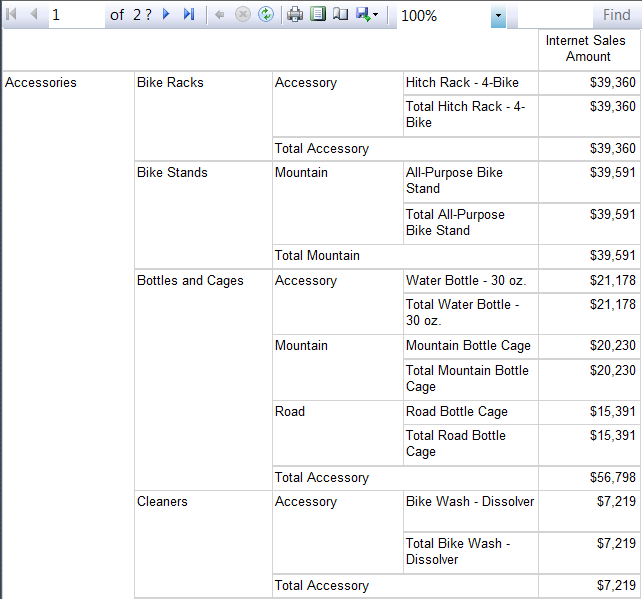
A stepped format displays row groups in staggered columns as in the example below:
 |
| Multi-Column Stepped Format |
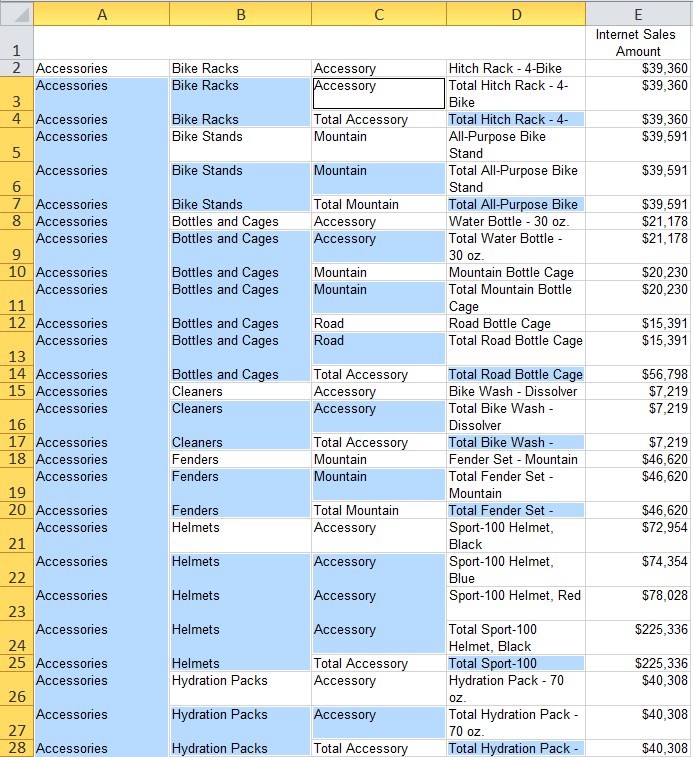
When this report is exported to Excel, it will look very similar to the report layout using merged cells to accomplish the formatting. To fill in the empty cells, follow the steps below:
NOTE: In order for the selection of blank cells in the steps below to work, you may need to enter "=Nothing" as the expression in the row group text boxes highlighted in red below:
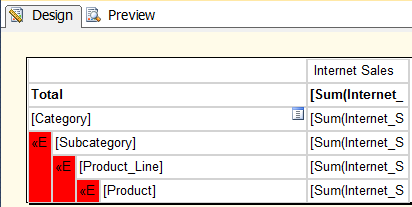 |
| Stepped Format Report Design |
- Click the Enable Editing button (if necessary)
- Select the cells for the entire worksheet
- From the Home tab, click Merge & Center -> Unmerge Cells
- You may want to widen the columns that contain the row groups (i.e., row labels), so that you can see the entire contents of the cells
NOTE: Here is where you may want to re-evaluate your report design. If Excel has had to create merged column cells in your table to accommodate lining up header images, report titles, etc., you may want to try to avoid that. By doing things like conditionally formatting header images to not export to Excel, stretching title text boxes to be the same width as the tablix, etc., the report will export in a more Excel friendly format.
- Select just the range of cells that represent the row groups (i.e., the row labels) of the tablix
- From the Home tab, click Find & Select -> Go to Special… -> Blanks
At this point just the blank cells that represent the row groups should be selected as in the image below:
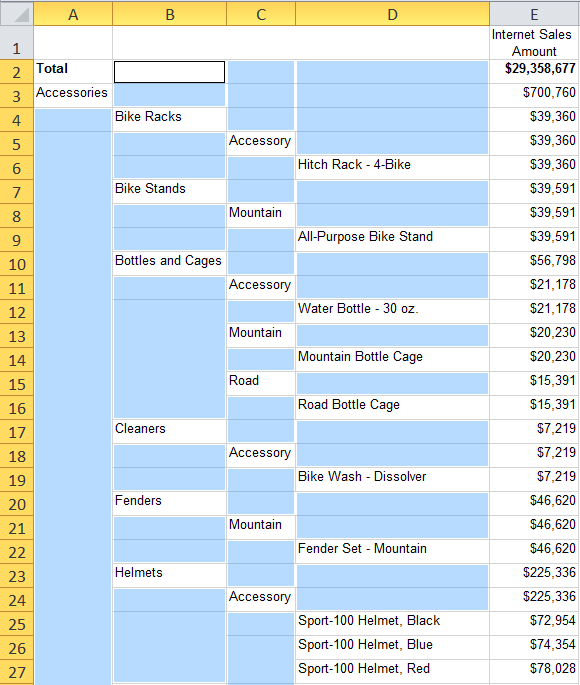 |
| With Blank Cells Selected |
- Holding down the Ctrl key, select a highlighted blank cell
- Click in the formula box and type =IF(LEN(A2), A2, 1/0) where A2 is the cell to the left of your selected cell (in my case B2). This formula states that if the cell next to the selected cell is populated with text, use that, otherwise fill the cell with 1/0 which will cause an Invalid Cell Reference Error
- Holding down the Ctrl key, hit the Enter key (this will copy the formula to all selected cells)
At this point you will have some cells that have been filled in with the correct information and others that show a #REF! error.
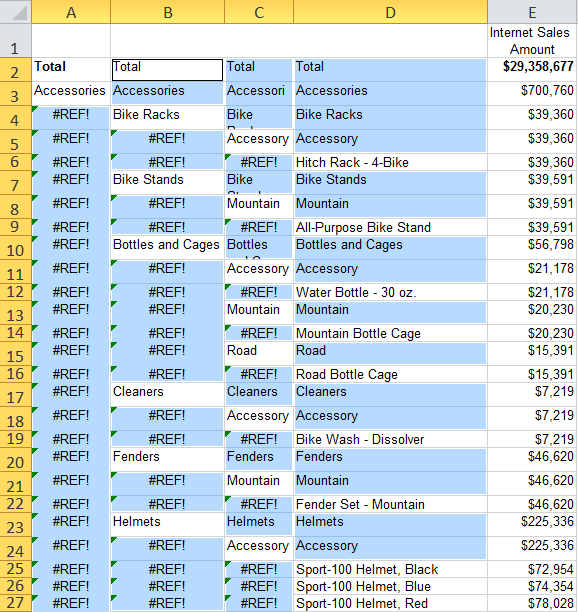 |
| With Cells Filled In |
- With the cells still selected, click Find & Select -> Go to Special… -> Formulas -> Errors (i.e., uncheck the Numbers, Text and Logicals checkboxes)
Now only the #REF! error cells should be selected, as in the image below:
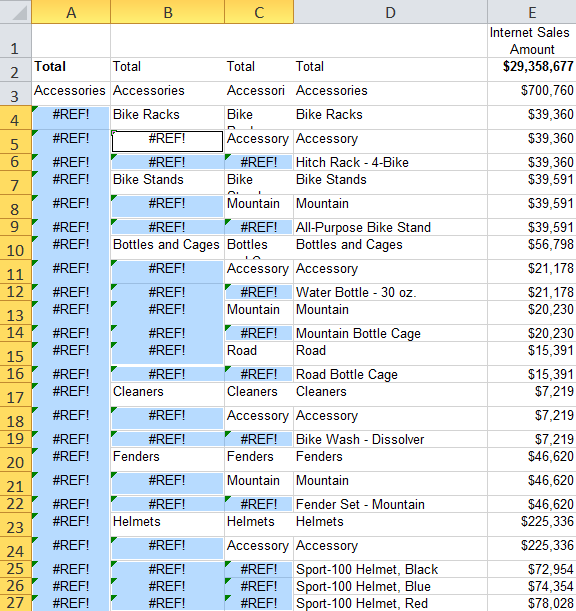 |
| With Error Cells Selected |
- Holding down the Ctrl key, select a highlighted blank cell
- Click in the formula box and type the equals sign (i.e., =) over the existing formula
- Click on the cell above the selected cell (e.g., if your selected cell is B5, click on B4)
- Holding down the Ctrl key, hit the Enter key (this will copy the formula to all selected cells)
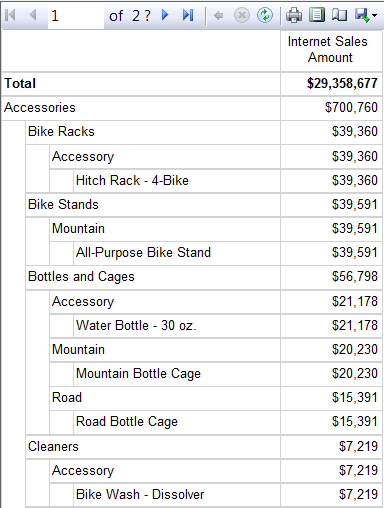
All of the cells should now be filled in with the appropriate data, as shown below:
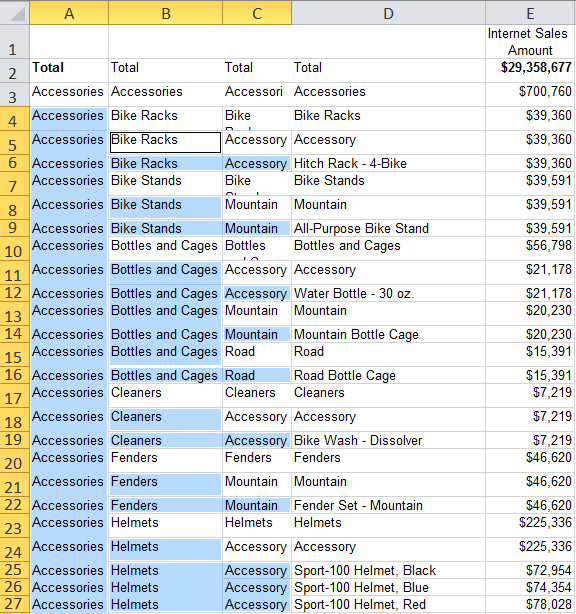 |
| With All Cells Filled In |
- Again, select just the range of cells that represent the row groups (i.e., the row labels)
- From the Home tab, click Copy
- Click Paste -> Values to replace the formulas with the actual values
You should now have a usable spreadsheet that you can sort, copy and paste rows into other worksheets, etc. Although it may have seemed like many steps to accomplish this task, once you've gone through it a couple of times, it will become a fairly simple Excel trick that you can add to your arsenal.