Showing posts with label PerformancePoint. Show all posts

Sunday, December 14, 2014

Mimicking PerformancePoint Filter Connection Formulas using the Query String (URL) Filter

In this post, I'm going to show you an easy trick using SharePoint's Query String (URL) Filter to create complex and dynamic dashboard filter connections for PerformancePoint Scorecards and Reports.

If you‘ve built any PerformancePoint dashboards, you’ve undoubtedly created and connected PerformancePoint Filters to scorecards and reports (Analytic Grids, Analytic Charts, Reporting Services Reports, etc.) to create powerful and interactive dashboards.

A simple (and maybe not so powerful) example, which I will build upon, would be creating a Customer Country filter using the AdventureWorks SSAS multi-dimensional database and connecting it to an Analytic Grid report summarizing data based on the Customer dimension's Customer Geography hierarchy, as in the figure below:

PerformancePoint Filter and Analytic Grid
Figure 1: A Not So Powerful Example of Using a PerformancePoint Filter
Slightly less common is utilizing a PerformancePoint Filter’s Connection Formula to filter a report in a more sophisticated manner using MDX functions (see Extend PerformancePoint dashboards by using MDX queries for a thorough explanation of Connection Formulas). For example, you could add the following simple MDX function as a Connection Formula to modify the filter connection created above:
<<UniqueName>>.Children
This formula would apply the Children MDX function to the value of the filter and when applied to the Customer Geography hierarchy, would summarize the measures by State-Province (i.e., the child level of Country).

Analytic Grid results using PerformancePoint Filter with a Connection Formula
Figure 2: A More Powerful Example Using a PerformancePoint Filter with a Connection Formula

The Query String (URL) Filter


Another filter that can be useful for PerformancePoint Dashboards is SharePoint's Query String (URL) Filter. This filter allows you to access a query string parameter and pass its value to a connected PerformancePoint Scorecard or Report. I use Query String (URL) Filters for a couple of different scenarios: one is when I want to link dashboards based on an attribute hierarchy by having a hyperlink on a dashboard (e.g., in an embedded SSRS report) which navigates to, for example, a dashboard focusing on a particular parent or child geographic area. The other scenario is when I have a parameter with hundreds or thousands of options (e.g., counties) and instead of populating a PerformancePoint Filter, I use a custom search box control to set a query string argument which is used to filter the dashboard. There are certainly drawbacks to this filter, like having to reload a page or having an attribute member value exposed in a URL, but it is also very powerful and it can open up new possibilities in your dashboard design.

Using this filter is fairly straightforward allowing you to add the filter to your dashboard and specify the query string parameter name. 

Query String (URL) Web Part Editor
Figure 3: Query String (URL) Filter Web Part Editor
By passing an attribute member value (e.g., [Geography].[Geography].[Country].&[United States]) in the “area” query string parameter, we can accomplish the same thing that the PerformancePoint Filter did without the Connection Formula. The URL would look something like the following, where "area" is the name of the query string parameter (make sure to URL encode the parameter value, otherwise it may not work):
http://servername/site/subsite/Dashboards/AdventureWorks/Page1.aspx?area=%5BCustomer%5D.%5BCustomer+Geography%5D.%5BCountry%5D.%26%5BUnited+States%5D
Using this type of filter opens up the possibility of dynamically controlling what is being summarized in a report via the URL. The problem with this approach, however, occurs when you want to create a more sophisticated filter using something similar to the PerformancePoint Filter's Connection Formula. There is no interface to enter a Connection Formula for a Query String (URL) Filter, so it can't be done. At least that's what I thought until recently when I started playing with the query string parameter value and discovered that I could apply MDX functions directly in the URL.
For example, we can use the same Children MDX function used above directly in the URL, passing [Geography].[Geography].[Country].&[United States].Children as the query string value. The URL encoded query string would look like the following:
http://servername/site/subsite/Dashboards/AdventureWorks/Page1.aspx?area=%5BCustomer%5D.%5BCustomer+Geography%5D.%5BCountry%5D.%26%5BUnited+States%5D.Children
This allows us to produce the exact same results as when we used the PerformancePoint Filter with the Children MDX function in the Connection Formula, as shown below:
Producing the Same Results Using a PerformancePoint Filter and a Query String (URL) Filter.
Figure 4: Producing the Same Results Using a PerformancePoint Filter (left) and a Query String (URL) Filter (right)
With this knowledge, I began to try slightly more complicated MDX formulas. For example, I could pass TopCount({Descendants([Customer].[Customer Geography].[Country].&[United States], 2)}, 10, [Measures].[Internet Order Count]) to get the top 10 U.S. cities based on Internet Order Count. The URL encoded string would look like:
http://servername/site/subsite/Dashboards/AdventureWorks/Page1.aspx?area=TopCount%28%7BDescendants%28%5BCustomer%5D.%5BCustomer+Geography%5D.%5BCountry%5D.%26%5BUnited+States%5D%2C+2%29%7D%2C+10%2C+%5BMeasures%5D.%5BInternet+Order+Count%5D%29
This would produce something similar to the following:
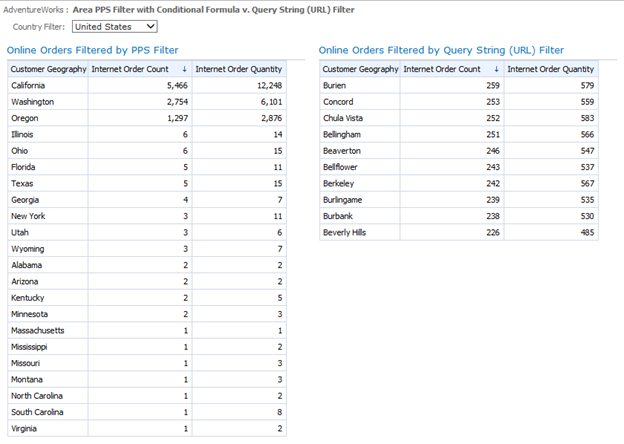
PerformacePoint Analytic Grid using a Query String (URL) Filter with a more complicated MDX function
Figure 5: Top 10 U.S. Cities Based on Internet Order Count (right side)

By this point
you can see that there is great potential in using a Query String (URL) Filter with MDX functions. Using this trick you can create very dynamic dashboards which can be controlled using query string parameters instead of having to hard code a conditional formula into PerformancePoint Filter. Just remember, as with anytime you are passing query string parameters in a URL, make sure that you understand how a savvy user may try to modify it to gain access to information that you did not intend.

Monday, September 30, 2013

PerformancePoint Multi-Select Tree Filter Zoom Issue in Internet Explorer

Recently I needed to create a Multi-Select Tree Filter for one of my PerformancePoint dashboards. I’ve created plenty of List Filters against Named Sets, Member Selections and MDX Queries in the past, and I’ve even created my own custom textbox PerformancePoint filters, but until recently, I hadn’t had the need for a Multi-Select Tree Filter. For a new dashboard that I was creating, I basically needed a simple checkbox list to use as a PerformancePoint dashboard filter and the Multi-Select Tree Filter fit the bill perfectly. It was easy to create and it seemed to work well too, until I attempted a live demo of the dashboard to an internal group.

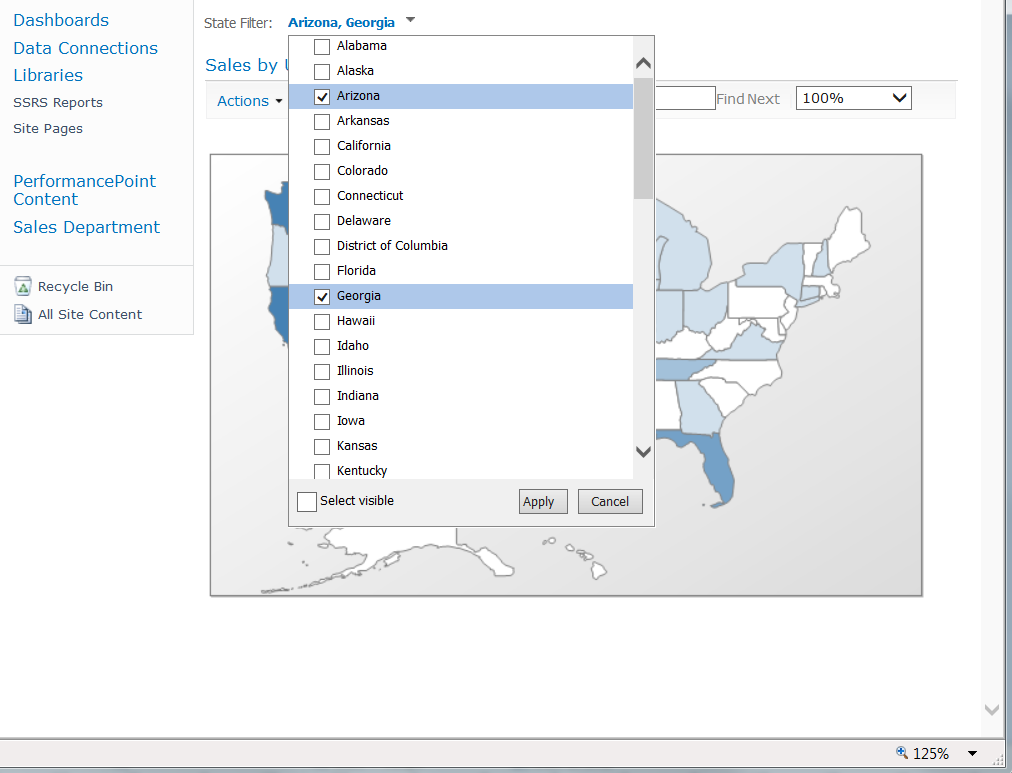
With the dashboard projected onto a wall and zoomed in using Internet Explorer’s zoom so that everyone could clearly view the dashboard, I expanded the filter, only to get something similar to the following:
 
 
A complete fail.

In the moment, I neglected to realize that it was IE's zoom causing the problem, although I quickly discovered that back at my desk. At 100% it displayed perfectly. As IE's zoom increased or decreased away from 100%, the list moved out of view either to the upper left or to the lower right, eventually, just showing the word "false". Setting a zoom level in Chrome worked fine (of course), which did help me in finding a solution rather quickly.
 
Using Chrome's Developer tools I found that one of the enclosing DIV elements that displays the dropdown was using the following filter:
 
.pps-tree-layer1 {
    filter: progid:DXImageTransform.Microsoft.Shadow(color=#333333,direction=130,strength=3)
}
 
Switching over to IE's Developer tools and disabling that filter, enabled the Multi-Select Tree Filter to display properly when zooming. A quick Google search for how to remove the filter via CSS yielded a blog post by Brian Johnson on How to Disable a CSS Filter in Internet Explorer. I applied that to the correct element as follows:
 
.pps-tree-layer1 {
    /* For IE 8+ */
    -ms-filter: "progid:DXImageTransform.Microsoft.Shadow(enabled = false)"!important;
    /* For IE 5.5 - 7 */
    filter: progid:DXImageTransform.Microsoft.Shadow(enabled = false)!important;
}

and viola...


Zoomed and displaying correctly!

Friday, February 22, 2013

The Broken “Export to Excel” Web Part Menu Item for PPS SSRS Web Parts and a Workaround

One of the side effects of using cumulative updates (CUs) is that functionality can break. I experienced this when applying the February 2012 CU to SharePoint 2010 SP1, which was required to fix some crucial functionality that was broken in SP1. The result, however, was that the "Export to Excel" web part menu item no longer worked for PerformancePoint Reporting Services web parts. The menu item is available, but instead of exporting, it opens the web part in the RSViewerPage.aspx page. Not real useful.

Upon some Googling, I found this forum entry indicating that the problem existed in the December 2011 CU and that it still exists with the December 2012 CU: http://social.technet.microsoft.com/Forums/en-US/ppsmonitoringandanalytics/thread/1d39d413-2756-450c-a40c-60c4dfe76fa1

As an additional note, this may be limited to an environment using SharePoint 2010 with SQL Server 2012 (this does work correctly with SharePoint 2010 SP1 with no CUs applied and SQL Server 2008 R2 SP1).

As the "Export to Excel" web part menu item was now rendered useless, I used PowerShell to loop through all of my dashboard pages, identifying the web parts that display PPS SSRS reports, and then hiding the "Export to Excel" menu item for those web parts so as not to confuse my dashboard users.

$webPart.IsAllowExportToExcel = "Hide" # Enabled, Disabled or Hide
$webPartManager.SaveChanges($webPart)

I left it at that for quite awhile, until in January I found time to revisit this problem and explore a workaround to allow the PPS SSRS web parts to be exported.

Something that I already knew worked correctly was the PPS SSRS web part’s toolbar’s exporting capability. So I could have just checked the "Show toolbar" checkbox in Dashboard Designer’s Report Settings for each of my SSRS web parts, but then the entire toolbar would display, taking up valuable real estate and providing unnecessary functionality for my dashboard web parts (e.g. page navigation, search, zooming, etc.), when I really only needed the exporting capability.

So instead I thought if I could dynamically show the toolbar, that would be an improvement over having it always being displayed. So again, with a little Googling, I found inspiration in the MSDN Library under an entry within the SQL Server 2012 Reporting Services Features and Tasks section called URL AccessParameter Reference. I could use query string arguments in the iframe element that displays the report to not only show the toolbar, but limit the toolbar functionality to just the exporting capability.

The next decision was how to incorporate this knowledge into my dashboard web parts. My first idea was to use jQuery to add a menu item, such as "Show Toolbar", to the web part’s menu, but I didn’t like how it would then take up real estate and cause my report to be partially obscured since I was setting the web part’s height. So instead I thought what if the toolbar only displayed when I opened the PPS SSRS web part in a new window using the web part’s "Open in New Window" menu item. Not perfect, but acceptable and relatively easy to accomplish. This would require editing the DynamicView.master and DynamicReportView.aspx files located in C:\Program Files\Common Files\Microsoft Shared\Web Server Extensions\14\TEMPLATE\LAYOUTS\PPSWebParts\ (I’ll leave it to you to determine how you would manage these two files and their deployment).
 
In the DynamicView.master file, I just had to add the PlaceHolderAdditionalPageHead server tag right before the closing HEAD tag (i.e. </head>):

<asp:ContentPlaceHolder id="PlaceHolderAdditionalPageHead" runat="server"/>

In the DynamicReportView.aspx file, I just had to add the following right before the "PlaceHolderMain" server tag:

<asp:Content ContentPlaceHolderId="PlaceHolderAdditionalPageHead" runat="server">
    <script src="../myScripts/jquery-1.7.1.min.js" type="text/javascript"></script>
    <!-- Shows Actions menu on toolbar (kb130521) -->
    <script type="text/javascript" language="javascript">
        function NotifyBrowserOfAsyncUpdate(elem) {
            $(elem).find('iframe[src*="%2Erdl"]').attr('src', function (i, val) {
                return val.replace('&rv:Toolbar=None&', '&rv:Toolbar=Full&rv:ToolBarItemsDisplayMode=128&')
            });
        }
        $(document).ready(function () {
            $('body').find('[text="Export to Excel"]').hide();
        });
    </script>
</asp:Content>

Like a couple of other blog posts that I have written, I’m using the NotifyBrowserOfAsyncUpdate function to notify the page when the asynchronous retrieval of the web part is complete. Then I use jQuery to find the iframe hosting the PPS SSRS web part and modify the "src" attribute to display the toolbar, but limit the menu items to just the export functionality. I additionally add a document ready function to hide the "Export to Excel" menu item that will appear in the web part's menu.

Now upon clicking a PPS SSRS web part menu's "Open in New Window" menu item, I get the following in a new window, showing the toolbar with just the Export menu option.


Thursday, January 31, 2013

Removing the Word "(Hidden) " from SharePoint Web Part Tooltips

When developing a dashboard in PerformancePoint 2010, one approach to managing the web parts that are displayed on the page is to use a PerformancePoint Filter to conditionally display web parts as a group. For example, I could have a filter that consists of the values "Market Share", "Dealers" and "Trend". By connecting this filter to web parts on the dashboard using the Display Conditions tab on the Configure Connection dialog, I can display certain web parts when "Market Share" is selected, others when "Dealers" is selected, etc.

The problem arises when, after a page refresh, you click on your filter to display a different group of web parts. The tooltip will now have the word "(Hidden) " prefacing the name of the web part in the tooltip for the web part menu, the web part icon and the web part description (see below).


Clearly the web part is not hidden. For whatever reason, this is indicating the initial state of the web part after a full page postback. Helpful? Not Really. Annoying? Definitely.

With a little jQuery, we can easily remove that word from all web parts in the document ready function.


$(document).ready(function () {
    // Remove "(Hidden) " from a title, img alt and td title tags
    $('td[title^="(Hidden) "]').each(function (index) {
        $(this).attr('title', $(this).attr('title').replace('(Hidden) ', ''));
    });
    $('img[alt^="(Hidden) "]').each(function (index) {
        $(this).attr('alt', $(this).attr('alt').replace('(Hidden) ', ''));
    });
    $('a[title^="(Hidden) "]').each(function (index) {
        $(this).attr('title', $(this).attr('title').replace('(Hidden) ', ''));
    });
});

There is certainly room for targeting the selector better here, but I did want to show that there are several tags that need to be addressed. Either way  the result is the same: a less confusing dashboard for your users.

Wednesday, October 31, 2012

The Problems with PerformancePoint 2010 Stack Selectors


When I initially started using the PerformancePoint 2010 Stack Selector, I thought it was a great way to provide consumers more options of how they viewed data on a dashboard, without taking up more screen real estate or bandwidth. But I’ve finally come to realize that by using them, I was losing some web part features and introducing some erroneous ones. Below are the primary reasons that I have since removed them from my dashboards for the project that I am currently working on.

1. The Stack Selector does not show the appropriate menu items based on the web part being displayed
This occurs when, for example, you have Analytic Reports mixed with Reporting Services Reports located within the same web part zone below a Stack Selector. The Stack Selector menu will show the Export to PowerPoint menu item for Reporting Services Reports, which results in the following error.


With some jQuery, it is possible to locate the Stack Selector’s menu and remove the Export to PowerPoint menu item when a Reporting Services Report is displayed, seemingly fixing the problem. Switching to an Analytic Report using the Stack Selector will cause an asynchronous update and the Export to PowerPoint menu will once again appear (again, using jQuery, this time to show the menu item).

The problem occurs when then switching back to the Reporting Services Report: it will be cached at this point so that an asynchronous update (i.e. partial postback) is not occurring and my jQuery is not executed, resulting in the Export to PowerPoint menu item being available for a Reporting Services Report.

2. The Stack Selector does not show the web part’s description or icon
I initially wasn’t using descriptions or icons with my web parts being displayed by a Stack Selector. However, as the dashboards became more complicated and the reports more sophisticated, I realized a tooltip description of each PerformancePoint web part would be helpful. Additionally, for the novice consumers, an icon indicating the different kinds of web parts (i.e. Analytic Reports, Scorecards, Reporting Services Reports, etc.) would clue them in on the differences in their capabilities (e.g. don’t waste your time right-clicking a web part with an icon indicating that it is a Reporting Services Report).

3. The Stack Selector does not retain the web part selection
This seemed like a minor issue at first, but as I interacted more and more with the dashboards that I was creating, I realized that I appreciated that the PerformancePoint Filters retained their selections between dashboards and between sessions and postbacks (i.e. in the case of using a Query String (URL) Filter). With the Stack Selector, I found myself constantly having to re-select the web part that I was interested in at the time.

Additionally, by using the Stack Selector, I had to deal with the problem addressed in a previous blog post: SharePoint Designer and the PerformancePoint StackSelector’s CurrentSelection Property Error.

I still believe the Stack Selector is useful, however its not quite as robust a control as I had initially thought it to be. In the end, I have eliminated the use of the Stack Selector and more heavily relied upon the PerformancePoint Filter's connections and display conditions to control the visibility of web parts on a dashboard.

Thursday, August 23, 2012

Default SSRS 2012 Parameters Pane to Collapsed in a PerformancePoint Reporting Services Web Part


Using PerformancePoint Reporting Services web parts on a dashboard is a great way to display information alongside Analytic Reports, in ways that aren’t supported by Analytic Reports (e.g. maps or scatter charts) or for data that doesn’t exist in your Analysis Services cubes. Offering visible parameters for your users to manipulate can additionally increase the value and interactivity of a report. However, when displaying a PerformancePoint Reporting Services web part with parameters, the parameters pane defaults to being expanded. Below is an example of a line chart that wouldn’t be easily possible using an Analytic Chart, with the parameters pane obscuring half of it.

Generally this is good (i.e. having the parameters pane defaulting to expanded), but if real estate is an issue (like in the image above), you may want that pane collapsed in its initial state. To work around this issue, we can use the NotifyBrowserOfAsyncUpdate event and some jQuery to locate a PerformancePoint Reporting Services web part and collapse the parameters pane, if it exists. Note, that this event is triggered for every PerformancePoint web part that is updated on a page.

function NotifyBrowserOfAsyncUpdate(elem) {
    // id of web part being updated
    var elemId = $(elem).prop('id');
    // find iframe sources that contain .rdl
    $('#' + elemId).find('iframe[src*="%2Erdl"]').attr('src', function(i, val) {
        return val.replace('&rv:ParamMode=Displayed&','&rv:ParamMode=Collapsed&')
    });
}

Now when your dashboard is displayed, the parameters pane will default to being collapsed, showing your chart, map or tablix in all of its glory.

Saturday, July 28, 2012

SharePoint Designer and the PerformancePoint Stack Selector’s CurrentSelection Property Error


For a project I'm currently working on, I needed some functionality that isn't (easily) supported by the dashboards that you can create with PerformancePoint Dashboard Designer. This includes adding non-PerformancePoint (custom and OOTB) web parts to the dashboards and making connections between PerformancePoint and non-PerformancePoint web parts. It is certainly  possible to add web parts and create connections after you save a dashboard in Dashboard Designer, but you would have to repeat the process anytime you needed to republish (i.e. save) your dashboard from PerformancePoint. The alternative is to use a web part page to create your dashboard, adding web parts and creating your connections through the browser.

Unfortunately, however, if you have to use SharePoint Designer 2010 for any of your dashboard customizations, you will run into some of the lack of support that it has for PerformancePoint. This posting has to do with one of the more minor annoyances.
When working with a web part page utilizing PerformancePoint web parts in SharePoint Designer 2010, you may notice the following error in the Design Page View after saving a page that contains a PerformancePoint Stack Selector:

Cannot create an object of type 'System.Collections.Generic.KeyValuePair`2[[System.String, mscorlib, Version=2.0.0.0, Culture=neutral, PublicKeyToken=b77a5c561934e089],[System.String, mscorlib, Version=2.0.0.0, Culture=neutral, PublicKeyToken=b77a5c561934e089]]' from its string representation '[, ]' for the 'CurrentSelection' property.

A similar error message is displayed in place of each Stack Selector on the page when it is viewed in a web browser.
A workaround is to remove the following attribute from each of the StackWebPart tags on the page and save again.

CurrentSelection="[, ]"
Unfortunately, as this is merely a stopgap fix, this has to be done every time you open, edit and save a web part page containing PerformancePoint Stack Selectors. Hopefully this is addressed in some future cumulative update (as a note, I am currently developing using the Feb 2012 CU (v14.0.6117.5002)).

Thursday, June 21, 2012

Setting a Default Selection on a PerformancePoint Scorecard


Depending on the design of your dashboard, you may want to set a default selection on a PerformancePoint Scorecard that is used as a filter for other web parts on a dashboard page.
As an example, consider a dashboard that contains a PerformancePoint Filter, Scorecard and an Analytic Report (Grid or Chart). The filter is used to filter the scorecard and the report. Additionally, the scorecard is used to filter the report based on a row member connection. The filter contains a list of manufacturers, the scorecard provides KPI for a list of products a manufacturer carries and the report displays the count of a selected manufacturer’s product sold by state. “Manufacturer 1” sells products A, B and C and “Manufacturer 2” sells products B, C and D.

One approach is to set the default of the Analytic Report to something that could make sense without a Scorecard filter being applied. By selecting default Members for the Analytic Report in Dashboard Designer, the dashboard defaults to displaying information, even without a scorecard selection. Depending on the complexity of your dashboard, the data, etc. maybe this is acceptable (this approach did not make sense for my particular dashboards).
Another approach is to select a Member (e.g. “Unknown” product that no manufacturer carries) that won’t produce any data in the Analytic Report. The resulting chart would look something like the following (note, I’m using a PerformancePoint Stack Selector, hence the web part title within a dropdown box):


Not great, but at least we aren’t misleading the dashboard user. I initially took this approach and went so far as to add a message in any PerformancePoint Reporting Services (i.e. SSRS report) web parts that were connected to the scorecard telling the user that they had to select a product (i.e. row) in the scorecard, if one wasn’t selected.
In the end, I wasn’t satisfied with this approach either, so I went Googling and stumbled across this question and response (http://stackoverflow.com/questions/3372565/performancepoint-sharepoint-2010-and-jquery) which turned up the NotifyBrowserOfAsyncUpdate event. This event is triggered for every PerformancePoint web part that is updated on a page. By using some jQuery and by identifying some PerformancePoint CSS classes, we can determine when the scorecard has been updated and whether or not we need to select a default row member by triggering a cell click event. I use the function below in an external script for use with multiple dashboards (I’ll leave it to you to streamline the jQuery as I have attempted to make it more understandable by adding comments and removing additional functionality).

function NotifyBrowserOfAsyncUpdate(elem) {
    var elemId, selector, rows, row;
    // id of web part being updated
    elemId = $(elem).prop('id');
    // .sctb is a PerformancePoint Scorecard class
    selector = '#' + elemId + " table.sctb";

    if ($(selector).length != 0) {
        // scorecard web part found! get rows that have a class that begins with "r-" (i.e. class|="r")
        rows = $(selector).find('tr[class|="r"]');
        // .scs is a PerformancePoint Scorecard’s selected row class
        if ($(rows).find('.scs').size() == 0) {
            row = $(rows)[0];
            // find head cell in first row and click
            if ($(row).children('th').size() != 0 && $(row).children('th')[0].length != 0) {
                $(row).children('th')[0].click();
            }
        }
    }
}


Because the cell click event is only triggered when a scorecard row is not selected, this will usually only happen when the page loads for the first time. This event would also be triggered when changing, for example, the manufacturer filter from “Manufacturer 1” with “Product A” selected in the scorecard to “Manufacturer 2”. As “Manufacturer 2” does not produce “Product A”, the click event is triggered and “Product B” would be the default scorecard selection.

Edit: June 14, 2014

When drilling up on a Scorecard from a root item that is not the first item, the "elem" element will be undefined and therefore a default row member will not get selected. In this case, which is likely to be infrequent, you can just use "table.sctb" as the selector. The revised function is provided below:

function NotifyBrowserOfAsyncUpdate(elem) {
    var elemId, selector, rows, row;

    if (typeof elem === 'undefined') {
        // occurs when drilling up to All in scorecard
        selector = "table.sctb";
    }
    else {
        elemId = $(elem).prop('id');
        selector = '#' + elemId + " table.sctb";
    }

    if ($(selector).length != 0) {
        // scorecard element found! get rows that have class that begin with "r-" (i.e. class|="r")
        rows = $(selector).find('tr[class|="r"]');
        if ($(rows).find('.scs').size() == 0) {
            row = $(rows)[0];
            // find head cell in first row and click
            if ($(row).children('th').size() != 0 && $(row).children('th')[0].length != 0) {
                $(row).children('th')[0].click();
            }
        }
    }
}

Wednesday, May 30, 2012

Breadcrumb Bar Style Dashboard Navigation

I recently needed to provide a breadcrumb on a SharePoint dashboard page which uses web parts to provide information about a sales territory area. Because the sales territories are defined as a hierarchy consisting of thousands of areas (e.g. regions which contain districts, districts which contain trade areas, and trade areas which contain counties), I chose to use a Query String (URL) Filter to pass an area to the dashboard page, rather than trying to load the areas into a PerformancePoint tree filter or multiple cascading filters. As a result, the page is much more light weight and easy to navigate, however, at the expense of having to do full postbacks to navigate between areas.

Conceptually, the area breadcrumb needed to show the area being viewed and the path to that area (i.e. all of its parents). Additionally, the parents could be links, providing a way to navigate to any of the parent areas. A very simplistic approach could display the information in a manner similar to the following:

National > Region 1 > District 1D > Trade Area 1D2 > Orange County, CA

But then I thought of the Breadcrumb Bar that was originally introduced with the Windows Vista version of Windows Explorer. These aren't drives, folders and files, but the hierarchical nature of the sales territories fit perfectly. The benefit of this approach would be to allow additional navigation possibilities to any of an area's parent's children (read on if that's not clear).

With a bit of Googling, I found a nice basis for my breadcrumb bar with this example: CSS-Only Dropdown Menu. It basically provides a very simple, yet elegant, drop down menu with a little javascript to handle the mouseover and mouseout events.

Breadcrumb Bar Example for Orange County, CA (this example should be interactive... at least it was when I originally posted it):


After dummying up an example of how I wanted the breadcrumb bar to look, I then had to decide how I would need to format the data to populate such a control. I came up with the following which required a stored procedure that basically has to determine each of the selected area's parents and the children of each of those parents (you'll have to design your own query based on your database design). Again, the following is what would be needed when passing "Orange County, CA":


AreaName
AreaType
AreaLevel
IsSelected
National
National
1
1
Region 1
Regions
2
0
Region 2
Regions
2
1
District 1A
Districts
3
0
District 1B
Districts
3
0
District 1C
Districts
3
0
District 1D
Districts
3
1
District 1E
Districts
3
0
District 1F
Districts
3
0
Trade Area 1D1
Trade Areas
4
0
Trade Area 1D2
Trade Areas
4
1
Trade Area 1D3
Trade Areas
4
0
Trade Area 1D4
Trade Areas
4
0
Los Angeles County, CA
Counties
5
0
Orange County, CA
Counties
5
1
Santa Barbara County, CA
Counties
5
0
Ventura County, CA
Counties
5
0


As an example, if I pass "District 1D" to the stored procedure, it would return "Region 2" and "National" (i.e. the parents of "District 1D") and "Region 1" (the additional child of "National") and the other children Districts of "Region 2".

Finally, I needed to build the control. I could have easily written a custom web part, but opted for a Data Form Web part instead. This basically required a bit of XSL to build the HTML. Again, I'll leave that exercise to you, the reader.

The final control also included an "enabled" flag that would allow me display the hierarchy, but disable parent areas that users did not have access to. This required an additional argument to the stored procedure of the user accessing the dashboard.

Although this post is light on code, I hope that it may help in creating your own breadcrumb bar for the navigation of a PerformancePoint dashboard.