Sunday, November 23, 2014

SSRS: Filling in Cells of Reports Exported to Excel (Part 2)

In my last post, SSRS: Filling in Cells of Reports Exported to Excel (Part 1), I showed how to fill in the cells of a block formatted report that has been exported to Excel. In this post we'll do the same thing for a stepped formatted report.

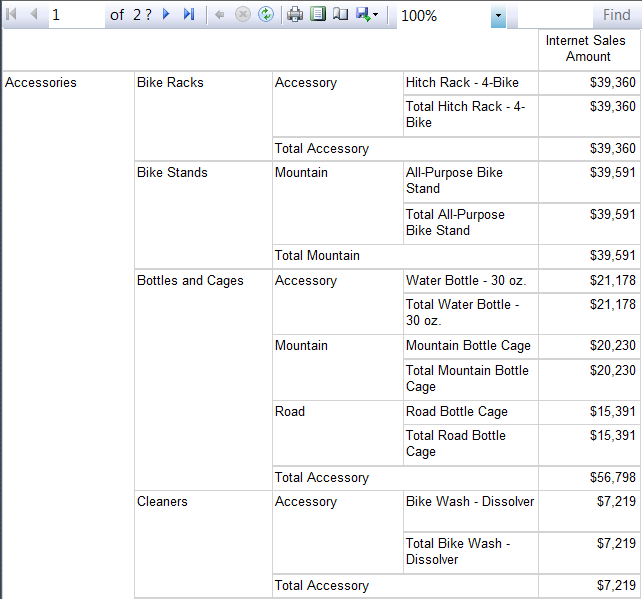
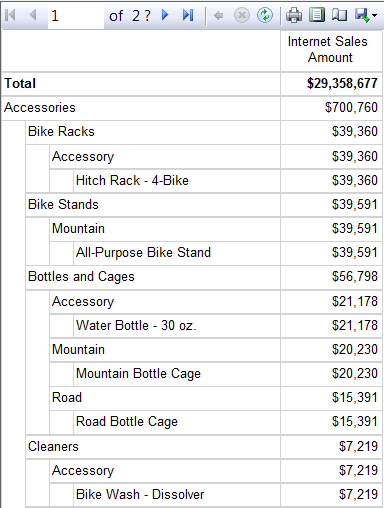
A stepped format displays row groups in staggered columns as in the example below:


Multi-column stepped format SSRS report example
Multi-Column Stepped Format
When this report is exported to Excel, it will look very similar to the report layout using merged cells to accomplish the formatting. To fill in the empty cells, follow the steps below:

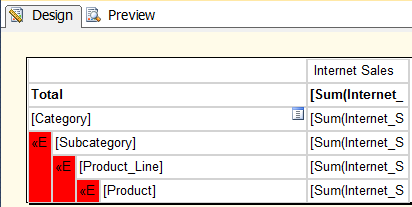
NOTE: In order for the selection of blank cells in the steps below to work, you may need to enter "=Nothing" as the expression in the row group text boxes highlighted in red below:


Highlighted text boxes in SSRS report indicating where to place "=Nothing" formula.
Stepped Format Report Design
  • Click the Enable Editing button (if necessary)
  • Select the cells for the entire worksheet
  • From the Home tab, click Merge & Center -> Unmerge Cells
  • You may want to widen the columns that contain the row groups (i.e., row labels), so that you can see the entire contents of the cells
NOTE: Here is where you may want to re-evaluate your report design. If Excel has had to create merged column cells in your table to accommodate lining up header images, report titles, etc., you may want to try to avoid that. By doing things like conditionally formatting header images to not export to Excel, stretching title text boxes to be the same width as the tablix, etc., the report will export in a more Excel friendly format.
  • Select just the range of cells that represent the row groups (i.e., the row labels) of the tablix
  • From the Home tab, click Find & Select -> Go to Special… -> Blanks
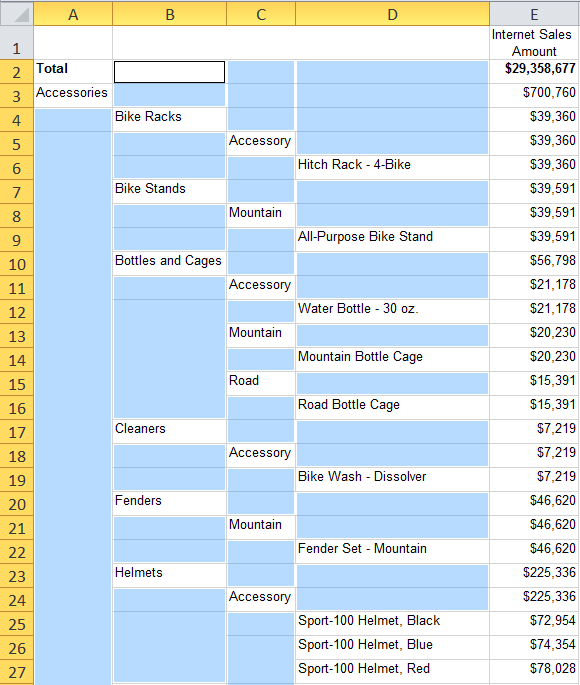
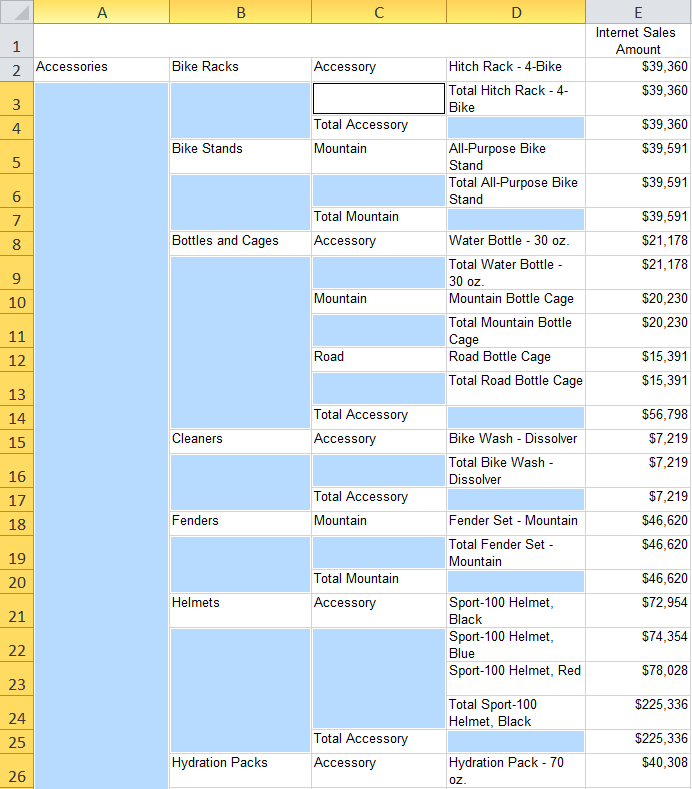
At this point just the blank cells that represent the row groups should be selected as in the image below:

Highlighting blank cells in SSRS report exported to Excel
With Blank Cells Selected
  • Holding down the Ctrl key, select a highlighted blank cell
  • Click in the formula box and type =IF(LEN(A2), A2, 1/0) where A2 is the cell to the left of your selected cell (in my case B2). This formula states that if the cell next to the selected cell is populated with text, use that, otherwise fill the cell with 1/0 which will cause an Invalid Cell Reference Error
  • Holding down the Ctrl key, hit the Enter key (this will copy the formula to all selected cells)
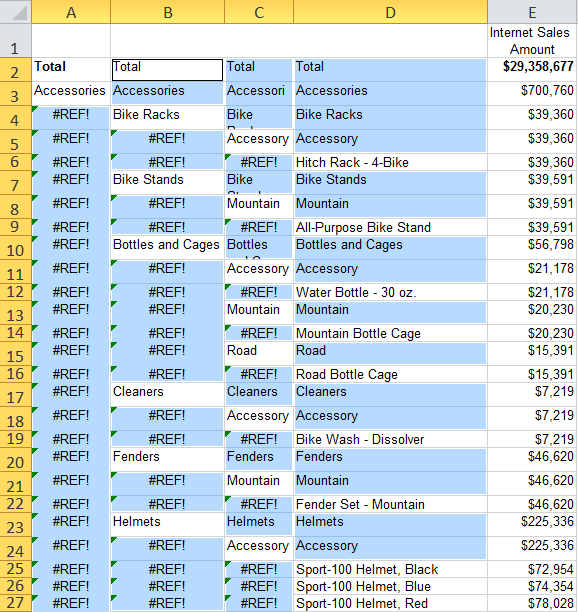
At this point you will have some cells that have been filled in with the correct information and others that show a #REF! error.

Populating blank cells with formula in SSRS report exported to Excel
With Cells Filled In
  • With the cells still selected, click Find & Select -> Go to Special… -> Formulas -> Errors (i.e., uncheck the Numbers, Text and Logicals checkboxes)
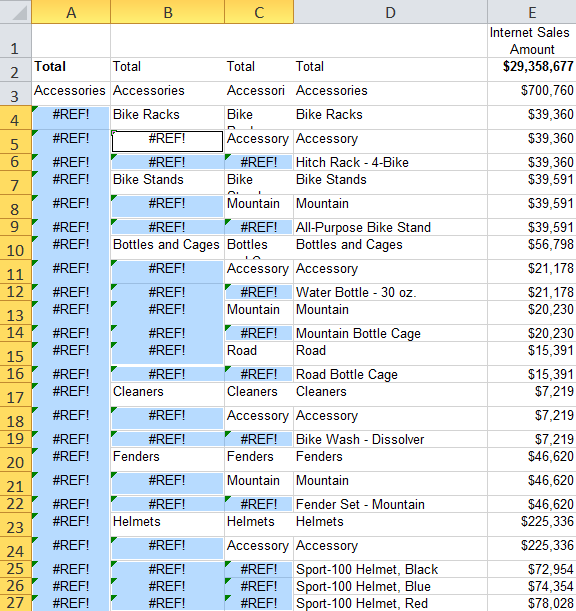
Now only the #REF! error cells should be selected, as in the image below:


Selecting error cells in SSRS report exported to Excel
With Error Cells Selected
  • Holding down the Ctrl key, select a highlighted blank cell
  • Click in the formula box and type the equals sign (i.e., =) over the existing formula 
  • Click on the cell above the selected cell (e.g., if your selected cell is B5, click on B4)
  • Holding down the Ctrl key, hit the Enter key (this will copy the formula to all selected cells)
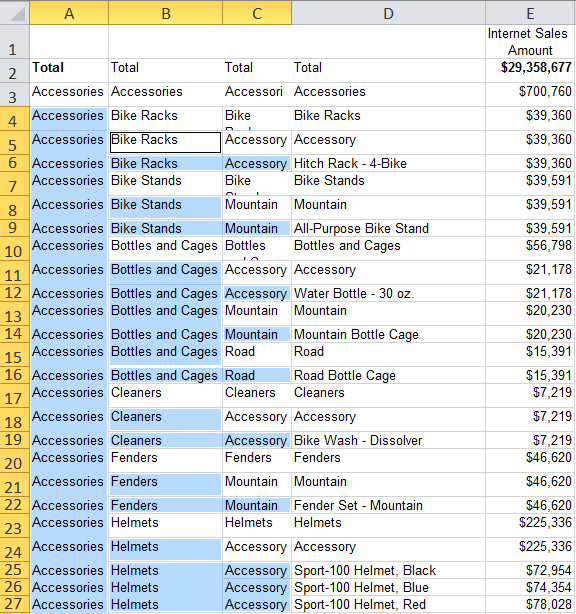
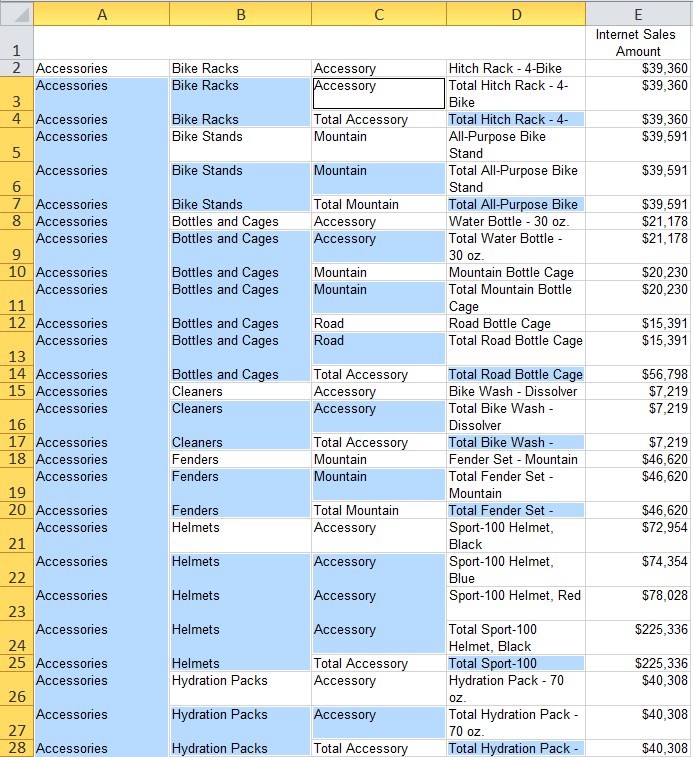
All of the cells should now be filled in with the appropriate data, as shown below:


Populating error cells with formula in SSRS report exported to Excel
With All Cells Filled In
  • Again, select just the range of cells that represent the row groups (i.e., the row labels)
  • From the Home tab, click Copy
  • Click Paste -> Values to replace the formulas with the actual values
You should now have a usable spreadsheet that you can sort, copy and paste rows into other worksheets, etc. Although it may have seemed like many steps to accomplish this task, once you've gone through it a couple of times, it will become a fairly simple Excel trick that you can add to your arsenal.

Sunday, November 9, 2014

SSRS: Filling in Cells of Reports Exported to Excel (Part 1)

Designing reports that have multiple row groups is a relatively common requirement in Reporting Services. This often means implementing either a block or multi-column stepped formatted report to display those groups (i.e., this post does not apply to a stepped format where all row groups appear in a single column using padding or spaces to offset the groups). The problem with these formats occurs once the report has been exported to Excel. To maintain the look of the report, Excel merges the cells of those row groups; however, to work with the data in Excel (e.g. sort, copy & paste selections into other worksheets, etc.) you’ll need to eventually unmerge those cells. Unfortunately, Excel doesn’t automatically fill in those unmerged cells with data where it exists. In part 1 of this 2-part post, I show how this can be accomplished for a block formatted report that has been exported to Excel.

A block format displays row groups in columns side by side as in the example below:


Block Format

When this report is exported to Excel, it will look very similar, using merged cells to accomplish the formatting. To fill in the cells, do the following after exporting the report to Excel:

  • Click the Enable Editing button (if necessary)
  • Select the cells for the entire worksheet
  • From the Home tab, click Merge & Center -> Unmerge

NOTE: Here is where you may want to re-evaluate your report design. If Excel has had to create merged column cells in your table to accommodate lining up header images, report titles, etc., you may want to try to prevent that. By doing things like conditionally formatting header images to not export to Excel, stretching title textboxes to be the same width as the tablix, etc., the report will export in a more Excel friendly format.
  • Select just the range of cells that represent the row groups (i.e., the row labels) of the tablix
  • From the Home tab, click Find & Select -> Go to Special… -> Blanks
At this point just the blank cells that represent the row groups should be selected as in the image below:

Blank Cells Selected
  • Holding down the Ctrl key, select a highlighted blank cell
  • Click in the formula box and type the equals sign (i.e., =)
  • Click on the cell above the selected cell (e.g., if your selected cell is C3, click on C2)
  • Holding down the Ctrl key, hit the Enter key (this will copy the formula to all selected cells)
With Cells Filled In
  • Again, select just the range of cells that represent the row groups (i.e., the row labels)
  • From the Home tab, click Copy
  • Click Paste -> Values to replace the formulas with the actual values
You should now have a usable spreadsheet that you can sort or copy and paste rows into other worksheets, etc.

In part 2 of this post, SSRS: Filling in Cells of Reports Exported to Excel (Part 2), I'll show how to do the same thing for a stepped formatted report, which is slightly more complicated.

Saturday, October 18, 2014

MDX: Top N by Group with All Others

When summarizing data using MDX, it’s a common requirement to find the top N by group (i.e., the top N tuples of one set for each member of another set). For example, you may need to find the top N brands by state or the top N products by calendar year based on sales count or amount. In MDX, this is accomplished using a combination of the Generate and TopCount functions. As an example, the following returns the top 5 products for each region based on sales amount:


WITH SET [Top N Products] AS
    Generate(
        [Sales Territory].[Sales Territory Region].Children
 , TopCount( 
            [Sales Territory].[Sales Territory Region].CurrentMember
  * [Product].[Product Categories].[Product].MEMBERS
            , 5
            , ( [Measures].[Internet Sales Amount] )
        ) 
    )
SELECT { [Measures].[Internet Sales Amount] } ON COLUMNS,
    NON EMPTY { [Top N Products] }  ON ROWS
FROM [Adventure Works]


This commonly available query uses the Generate function to evaluate the set produced by the TopCount of the cross product of regions and products, and applies it to each of the region member's children. This produces the following results:

Results of a Top N by Group MDX Query
Top N by Group Results

But this only provides part of the picture. Typically, I would want to include all other products within each region as well so that I could provide context to the top N items. For example, in a report (which could also be accomplished using MDX... but let's keep the MDX straightforward for this post) I could calculate each product's percent of sales within each region or each region's percent of sales versus all sales. In order to produce the all other products row for each region, we need to create a new calculated member (i.e., [All Other Products]) using the Aggregate and Except functions.

WITH SET [Top N Products] AS
    Generate(
        [Sales Territory].[Sales Territory Region].Children
 , TopCount( 
            [Sales Territory].[Sales Territory Region].CurrentMember
  * [Product].[Product Categories].[Product].MEMBERS
            , 5
            , ( [Measures].[Internet Sales Amount] )
        ) 
    )
    MEMBER [Product].[Product Categories].[All Other Products] AS 
 Aggregate( 
     Except( 
  NonEmpty( 
             { [Sales Territory].[Sales Territory Region].CurrentMember 
      * [Product].[Product Categories].[Product].MEMBERS } 
  )
  , [Top N Products] 
     )
 )
SELECT { [Measures].[Internet Sales Amount] } ON COLUMNS,
    NON EMPTY { 
 [Top N Products]
 , ( 
     [Sales Territory].[Sales Territory Region].[Sales Territory Region] 
     , [All Other Products] 
 ) 
    } ON ROWS
FROM [Adventure Works]

The Aggregate function takes a set (e.g., the cross product of region and product) and aggregates a measure (e.g., sales amount) within the current context. However, we additionally must use the Except function to exclude the top N products for each region from the aggregate. 

While the NonEmpty function within the Except doesn't make a difference in this example, it can provide a significant performance gain depending on the cross product that is being evaluated.

This query results in the following (as a note, I did use an Order function so that All Other Products would sort within each group, but I left it out of the MDX to keep the example clear):

Results of a Top N by Group with All Others MDX Query
Top N by Group with All Others Results

Although the MDX is a little more complicated, the results are much more useful, providing a basis for creating context for your top N values.
Wednesday, September 17, 2014

Migrating a Visual Studio 2003 ASP.NET Project to Visual Studio 2013 and IIS Express

Recently I had to migrate a Visual Studio 2003 ASP.Net project to Visual Studio 2013. I know, so many questions… why hadn’t this project ever been migrated in the past, how did a project survive so long without getting migrated, how is this guy still employed, etc. All great questions. The simple answer is that I had some old projects on an old XP machine that gave up the ghost. I therefore had to migrate the projects to another machine where I had Visual Studio 2013 using IIS Express installed.

Like any good developer, I did not research what issues I might face in making such a leap forward. I just went ahead and tried to open the old project in Visual Studio 2013, hoping that the Microsoft engineers who designed Visual Studio would have had the forethought to imagine that someone would try something so ridiculous. However, after 20 seconds of Visual Studio contemplating what to do with my request, it responded with an error messagebox stating the following:


The operation could not be completed. The system cannot find the path 
specified.

Not very helpful. Fortunately, after clicking OK on the above message, the Migration Report (updatelog.htm) opened automatically and provided me with the following error that was a little more useful:

MyProjectName.csproj: Could not find the server 'http://localhost/MyProjectName/MyProjectName.csproj' on the local machine. Creating a virtual directory is only supported on the local IIS server.


Kind of made sense. I was moving from a development environment that used IIS 6 to one that used IIS Express. A Google search of that error yielded many results, but none that were specific to migrating a project and pertinent to my situation. So instead I rooted around my project's files to figure out where it was picking up the virtual directory information and quickly found the project’s .webinfo file (i.e., MyProjectName.csproj.webinfo). The .webinfo file (something I never really paid attention to before) is a developer specific file that keeps track of the project’s virtual root location. It's contents look like this:

<VisualStudioUNCWeb>
    <Web URLPath = "http://localhost/MyProjectName/MyProjectName.csproj" />
</VisualStudioUNCWeb>

So I threw caution to the wind and experimented. I renamed the .webinfo file (e.g. @ MyProjectName.csproj.webinfo) and tried to open the .csproj file again. This time Visual Studio 2013 quickly responded with the following informative messagebox:

You have completed the first step in converting your Visual Studio .NET 2003 
web project. To complete the conversion, please select your project in the 
Solution Explorer and choose the 'Convert to Web Application' context menu 
item.

The Migration Report that followed additionally gave a few warnings regarding making “non-functional changes without impacting project behavior”. But everything seemed to work fine when I attempted to run it and, as it turned out, there was no need to convert the project to a web application.

However, when running the project, the pages were running from the root of localhost rather than in a virtual directory like I was used to seeing in the VS2003 development environment. As an optional step, this simply required editing the Project URL (e.g. adding MyProjectName to the URL) from the project's properties Web tab (i.e. right-click the project, select Properties and then the Web tab) and clicking the Create Virtual Directory button.

Next stop for my migrated project: refactoring EVERYTHING.

Tuesday, August 12, 2014

Downloading and Extracting US Census Bureau TIGER/Line Shapefiles

The United States Census Bureau (census.gov) site is a great resource for free spatial data such as state, county, census tract, etc. boundary files. These files can be used as is or used as a building block for creating custom sales territories. They can be loaded into SQL Server for use in spatial queries or for displaying boundaries on a map in an SSRS report. They can also be used to build map tiles for use with the Bing Maps API. This post, however, is focused on downloading and extracting these files.

These TIGER (Topologically Integrated Geographic Encoding and Referencing)/Line Shapefiles are available in many vintages, including definitions from the 1990, 2000 and 2010 censuses, with annual updates through 2013 (2014 should be available soon). The Census Bureau site provides several ways to access and download these files, but the easiest way is to use their FTP site (ftp://ftp2.census.gov/).

You can use an FTP client or, as shown here, you can simply use Windows Explorer.

Start by opening Windows Explorer and pasting ftp://ftp2.census.gov/ directly into the address bar. 

Navigate to the geo/tiger/. From this folder you will see the different vintages of TIGER files available. To illustrate the next step, lets say we're interested in the 2013 Census Tract boundaries.

Navigate to the TIGER2013/TRACT folder. In the right hand window (i.e. file list), you'll see a list of compressed (.zip) files with names based on the State FIPS Code, which is a two character numeric code assigned to each state, the District of Columbia and outlying areas of the U.S. (Puerto Rico, Guam, etc.).

Select the ZIP files you're interested in. I'm only interested in the U.S. states and DC, so I'm selecting files tl_2013_01.zip (AL) through tl_2013_56.zip (WY).

Right-click one of the selected files and select Copy from the popup menu.

Navigate to a folder on your local network, right-click the folder and select Paste. This may take a few minutes. I'll wait.

Now that you have the files on your local network, we need to extract (i.e. unzip) them. Unfortunately Windows Explorer falls short when needing to unzip multiple files. If you already have WinZIP or WINRAR installed, you could use either of those to unzip multiple files. I don't, so I'm going to use the following PowerShell script that I found on Steve Schofield's Blog

function UnZipMe($zipfilename,$destination) 
{ 
    $shellApplication = new-object -com shell.application 
    $zipPackage = $shellApplication.NameSpace($zipfilename) 
    $destinationFolder = $shellApplication.NameSpace($destination) 

    # CopyHere vOptions Flag # 4 - Do not display a progress dialog box. 
    # 16 - Respond with "Yes to All" for any dialog box that is displayed. 

    $destinationFolder.CopyHere($zipPackage.Items(),20) 
} 

# replace the following with the folder that contains your zipped files
$a = gci -Path C:\Data\USCBCensusTracts2013 -Filter *.zip 

foreach($file in $a) 
{ 
    Write-Host "Processing - $file" 
    UnZipMe –zipfilename $file.FullName -destination $file.DirectoryName 
}

Once this script finishes running, you will have all of your shapefiles ready to work with.

Wednesday, July 9, 2014

Getting the Last Run Report Parameter Value for an SSRS Report

I recently had a request by a report user to change the default for a couple of parameters in an SSRS report. Because default values were set on the report, it would automatically run when opened and the user would have to change the parameters to his preference and run the report again… every time. This seemed like a reasonable request except for the fact that the report was used by many people who did not necessarily want the default values changed. The alternative of not setting default values and forcing all report users to select them prior to running the report was an option, but would negatively impact those report users who were already satisfied with the existing defaults.

As the users of this report were rarely changing these particular parameters (other than to change the default value), I thought that if I could get the last value that they specified when running the report, it would generally be the value they’d prefer to use as the default.

Having created a few reports summarizing SSRS usage in the past, I knew that the parameters were logged, however rather than trying to write something from scratch, I turned to Google for an answer and came upon this blog post by Jegan, SSRS - Method to retrieve last run report parameters, which laid most of the groundwork for me.

In the post, he lays out a simple query to access all of the entries in the ExecutionLogStorage table for a single report. He then goes on to get a parameter value from the Parameters field for the most recent entry using knowledge of the existence of a second parameter to parse the string. I take a different tact below, using the parameter name/value pair delimiter (i.e. the ampersand) and the equals sign to isolate the parameter name (that's why I added the ampersand to the beginning of the parameter list) and value.

The result below handles parameter name/value pairs at the beginning or the end (why I add the ampersand to the end of the parameters list) of the string as well as anywhere in between. It also handles the case where the parameter name doesn't exist in the string (IIF) or if no records exist (UNION ALL) for the report name and user name combination. There are many ways to write the query below and get the correct results... I tried to write this for performance and the clarity of the SUBSTRING function.

SELECT TOP 1 ParValue
  FROM (
    SELECT els.TimeEnd 
      , IIF(CHARINDEX('&' + 'ParName' + '=', ParsString) = 0, 'DefaultParValue',
        SUBSTRING(ParsString 
          , StartIndex
          , CHARINDEX('&', ParsString, StartIndex) - StartIndex)) AS ParValue
      FROM (SELECT ReportID, TimeEnd 
            , '&' + CONVERT(VARCHAR(MAX), Parameters) + '&' AS ParsString 
            , CHARINDEX('&' + 'ParName' + '=', '&' + CONVERT(VARCHAR(MAX), Parameters) + '&') 
              + LEN('&' + 'ParName' + '=') AS StartIndex 
          FROM ExecutionLogStorage
          WHERE UserName='UserName' -- e.g. DOMAIN\Joe_Smith
          ) AS els 
        INNER JOIN [Catalog] AS c ON c.ItemID = els.ReportID
      WHERE c.Name = 'ReportName.rdl'
    UNION ALL
    SELECT CAST('2000-01-01' AS DateTime), 'DefaultParValue' 
  ) i
  ORDER BY TimeEnd DESC

The above could be re-written to get the values of several parameters at the same time to be used within a single SSRS dataset, however not much is gained as Reporting Services executes the dataset query for each parameter that it is attached to. Therefore, it may make sense to parameterize the arguments (i.e. the user name, report name, parameter name, and default parameter value) and turn it into a stored procedure. This may also prevent you from having to add a data source pointing to your Reporting Services database.

A few things to note when using this code to access parameter values for use within an SSRS report...

First, if you have Boolean parameters that you wish to use this with, you’ll have to convert them to Text. Also, it should be clear that this does not work with multi-value parameters (I'll save that for a future post).

Second, as Jegan notes in his blog post, "the parameter value passed to the report when previewing in visual studio won't be logged in ReportServer database as the report execution is not from ReportServer". This means you will need to deploy the report to see that the default changes on subsequent report launches.

Finally, in my environment, passing Globals!ReportName as a parameter value in Visual Studio 2010 returns “ReportName” (i.e. the report name without the extension), whereas 2012 SQL Server Reporting Services (Sharepoint integrated mode) returns “ReportName.rdl”. Just something to be aware of as you need to use the report name with the extension.

Oh, just one more thing. Many would advise against this as its hitting the Reporting Services database which could affect performance, or Microsoft could change the database structure, breaking your query, etc. Use at your own risk.

Sunday, June 15, 2014

Creating Map Tiles (Part 3) - Generating Tiles from a TileMill Project Using MBUtil and PowerShell

This post is a continuation of Creating Map Tiles (Part 2) - Creating a Sales Territory Boundary Set Using TileMill, where I prepared my transparent boundary set in TileMill. In this post I use PowerShell to call TielMill and MBUtil to generate the map tiles.

As I mentioned in Part 1, for much of the process of creating map tiles I relied on an excellent series of posts by Pedro Sousa on his blog, Pedro's Tech Mumblings. In Part 2 of his series, he walks you through how to export your TileMill project to a MBTiles SQLite file and then use MBUtils (a command line MapBox tool) to export the map tiles. Below, I've taken a the same approach but created a PowerShell script to automate the process.

In order to perform this process manually or using the PowerShell script below, you need to install Python with SQLite and MBUtils. Pedro walks you through this, however I performed the following steps outlined in the accepted answer to Is there any way to use mbutil on windows? posted on StackExchange.
  • Download and install ActiveState Active Python 
  • Install MBUtil by downloading and unzipping to C:\mbutil-0.2.0.
  • From a command-line navigate to C:\mbutil-0.2.0 and run "setup.py install" to install mbutils
At this point the pre-requisites for the following PowerShell script exist. 

function CreateTiles() {
    param(
        [Parameter(mandatory=$true)] [string]$project,
        [Parameter(mandatory=$true)] [string]$inputPath,
        [Parameter(mandatory=$true)] [string]$outputPath
    )
    # delete .mbtiles, .export and .export-failed files
    remove-item  "$($inputPath)$($project).*"
    
    # delete directory
    $pngPath = $outputPath + $project
    if (test-path $pngPath){
       write-host "Deleting $($pngPath)... this may take awhile." 
       #remove-item $pngPath -recurse  # very slow
       $fso = New-Object -ComObject scripting.filesystemobject
       $fso.DeleteFolder($pngPath, $true)
    }
            
    # Create mbtiles file. Requires TileMill.
    # changed the following so that the executable's path doesn't 
    # contain spaces (i.e. using the call (&) operator is optional)
    cd "C:\Program Files (x86)\TileMill-v0.10.1\tilemill\"
    $mbtilesFile = "$($inputPath)$($project).mbtiles"
    & ".\node.exe" ".\index.js" "export" $project $mbtilesFile "--format=mbtiles"
    
    # Create PNGs from mbtile file. Requires:
    # Python with SQL Lite (install ActivePython);
    # MB Util (download mbutil zip from https://github.com/mapbox/mbutil/tree/v0.2.0).
    python "C:\mbutil-0.2.0\mb-util" --scheme=xyz $mbtilesFile $pngPath
}

CreateTiles "State_And_County_Boundaries" "C:\SHPs\" "C:\MapTiles\"

The first step in the script removes the existing MBTiles files, if they exist, which will block the creation of the new file. It also deletes the existing path of previously created tiles. This is necessary because I don't want to have any old tiles mixed with the new (remember not all tiles are generated within the bounds set in the TileMill project because my map has a transparent background). Depending on the number of tiles generated in a previous run, this can take awhile.

The second step is what you can do manually from TileMill by clicking the Export button in the main toolbar and selecting MBTiles. It calls TileMills index.js file and is documented here on the MapBox site.

The final step calls the MBUtils executable to produce the map tiles in a set of folders based on the XYZ tiling scheme.

The files now just have to be copied to a web server where they can accessed by the Bing Maps API. The following, modified from a function taken from another of Pedro's blog posts (taken in turn from a blog post by Alastair Aitchison), shows how the tiles can be called from the Bing Maps API using JavaScript:

var tileSource = new MM.TileSource({ 
    uriConstructor:  function getTilePath(tile) {
        // only created custom tiles for zoom 0-12
        if (tile.levelOfDetail <= 12) {
            var x = tile.x;
            var z = tile.levelOfDetail;
            var yMax = 1 << z;
            var y = yMax - tile.y - 1;

            return "Images/Tiles/BaseMap4/" + z + "/" + x + "/" + y + ".png";
        }
    }
});

var tileLayer = new MM.TileLayer({ mercator: tileSource, opacity: 1 });

// Push the tile layer to the map
map.entities.push(tileLayer);

One of the modifications that I made to the above prevents the call to retrieve tiles that were not generated for certain zoom levels. This will prevent the server from having to generate a multitude of 404 error response codes as you zoom below the level for which tiles were generated. Another modification that I made to my own code (not included above) was to add a version argument to the end of the URL which is retrieved from a web service call to the database when the page initially loads. I use this argument to force the fetching of new tiles when the tiles have been replaced on the server.


The Tile Layers Used with the Bing Maps API

Using the PowerShell script above, I have been able to generate three different, fairly static boundary sets, consisting of 3 to 5 layers each (resulting in around 100,000 tiles for each set). Along with the script from Part 1, Creating Map Tiles (Part 1) - Exporting MapInfo TAB Files to ESRI SHP Files Using PowerShell and MapInfo, I have been able to automate the creation of an additional two boundary map tile layers that have to be generated monthly, due to changes in the boundary definitions.